
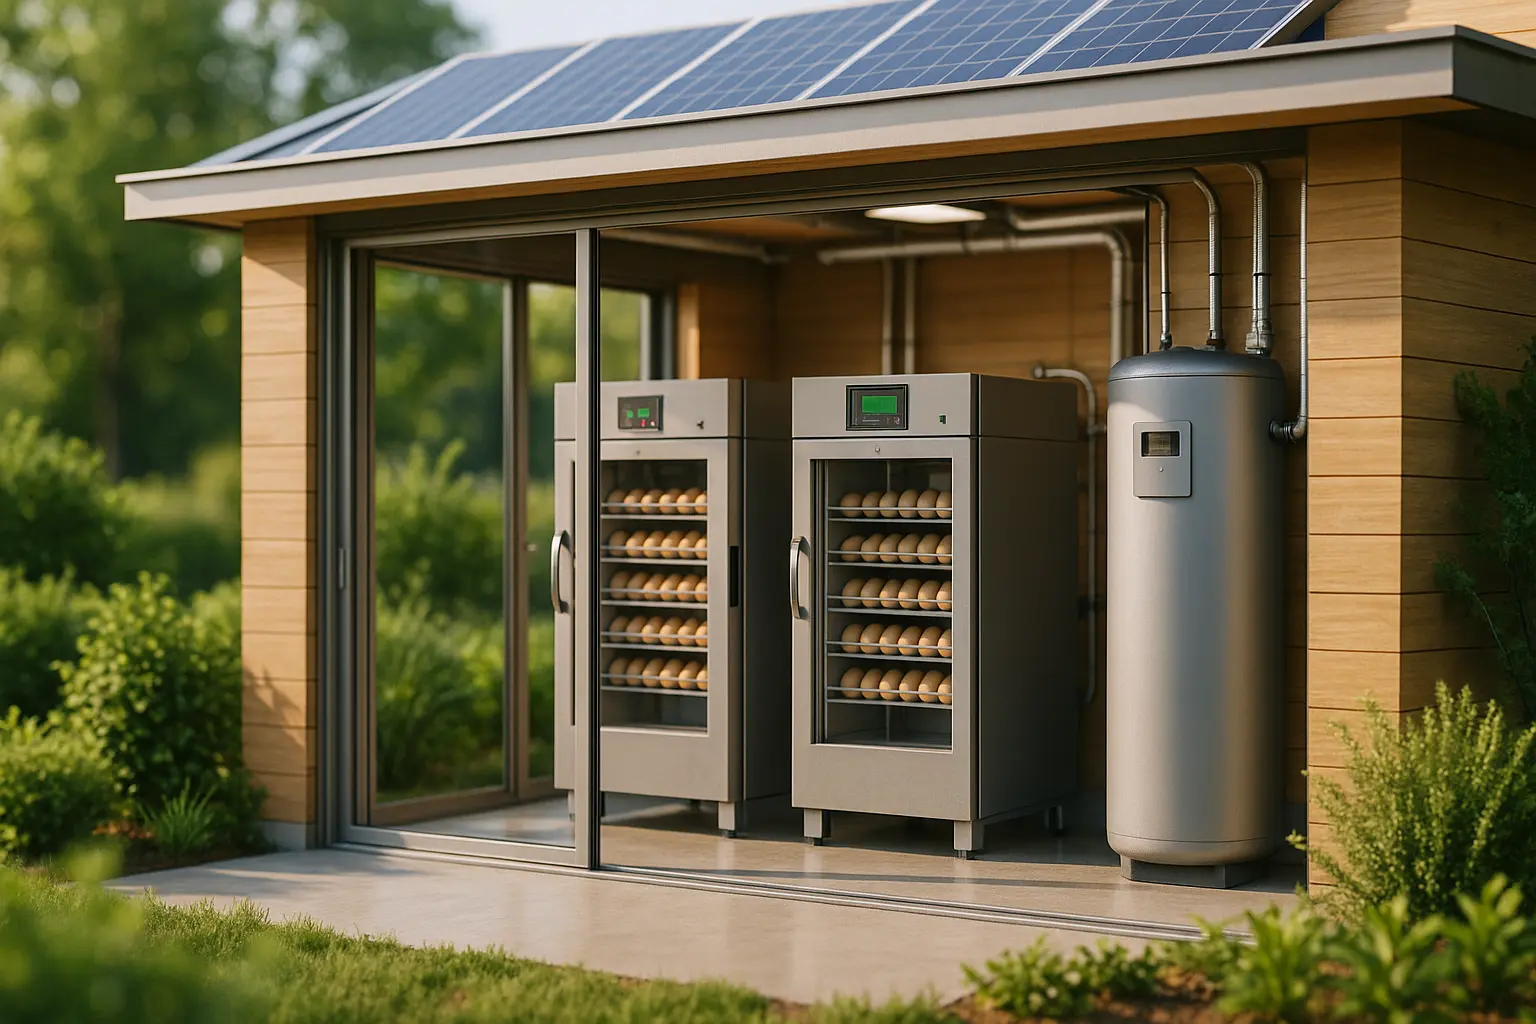
As we stand at the dawn of new ecological horizons, the role of energy and sustainability in aquaculture is more vital than ever. The world is moving towards a greener planet, and hatcheries are no exception. While the global demand for fish as a food source increases, we must confront the challenge of environmental stewardship with innovative vigor. This article explores the dynamic interplay between sustainable practices and energy-efficient solutions within hatcheries, ultimately painting a picture of a more balanced future for aquaculture. We believe it’s not only possible but essential to create systems that are mindful of both production and preservation.
Harnessing Sustainable Energy in Hatchery Systems
In the quest for a more sustainable aquaculture, the integration of renewable energy sources has become a cornerstone. Traditionally powered by fossil fuels, hatcheries have long grappled with balancing energy needs and environmental impact. Today, we are witnessing a shift towards greener alternatives, such as solar and wind energy, which offer cleaner, more sustainable options for powering hatchery systems.
Solar energy, with its minimal carbon emissions, serves as a promising solution. By installing solar panels on facility rooftops or open spaces, hatcheries can harness the abundant energy of the sun. This not only reduces their carbon footprint but also cuts down on operational costs, fostering a more sustainable production model. Additionally, wind turbines, although less common, are gaining traction, particularly in regions with favorable wind conditions.
Beyond renewable energy, innovative energy management technologies are being employed to optimize energy use within hatcheries. Smart grid systems, for instance, allow facilities to monitor and adjust energy consumption in real-time, ensuring efficient use of resources. This is complemented by energy storage solutions, such as battery systems, which help balance energy supply and demand.
By embracing these sustainable and energy-efficient practices, hatcheries can play a pivotal role in fostering a more sustainable future for aquaculture. It’s a proactive approach that not only addresses the immediate needs of fish farming but also safeguards the environment for future generations.
Innovations in Fish Hatchery Management for Sustainability
In recent years, the focus on sustainable management within hatcheries has surged, driven by the need to minimize environmental impact while maximizing production efficiency. One area of innovation has been the development of integrated multitrophic aquaculture (IMTA) systems, which mimic natural ecosystems by combining species with complementary roles.
These systems operate on the premise that waste products from one species become resources for another, creating a balanced and sustainable farming environment. For example, nutrient-rich effluents from fish can be used to cultivate aquatic plants or shellfish, ultimately reducing waste and improving water quality. This holistic approach not only increases the productivity of hatcheries but also enhances their environmental compatibility.
Another groundbreaking development is the adoption of recirculating aquaculture systems (RAS), which are designed to minimize water use and enhance biosecurity. RAS technology utilizes a continuous loop of water filtration and recirculation, drastically reducing the need for fresh water intake. This closed-loop system not only conserves water resources but also creates controlled conditions that are conducive to the healthy growth of fish.
Advanced data analytics and smart technology are also making their mark in hatchery management practices. By leveraging real-time data and analytics, hatcheries can make informed decisions about production, feeding, and health management, optimizing their operations for both efficiency and sustainability. These innovations are crucial as we strive to meet the growing global demand for fish while preserving the integrity of our aquatic ecosystems.
The Role of Climate Resilience in Hatchery Practices
As climate challenges escalate, hatcheries find themselves at the frontline, needing to adapt and innovate faster than ever. Climate resilience is no longer an option; it’s a necessity if we hope to ensure the continued success of aquaculture in a world facing unexpected shifts.
One critical element in building climate resilience is the careful management of water resources. With rising temperatures and unpredictable weather patterns, maintaining stable water conditions is paramount. Hatcheries are turning to advanced water quality monitoring systems that provide real-time data, enabling timely interventions to maintain optimal conditions for fish health.
Moreover, hatcheries are adopting adaptive practices such as diversifying the species they cultivate. By selecting fish species that are more tolerant to temperature fluctuations and other climate impacts, hatcheries can better withstand environmental changes. This strategic development not only safeguards the production process but also contributes to overall ecosystem health and stability.
Incorporating climate-smart infrastructure is another avenue for improving resilience. This includes constructing or retrofitting hatcheries to withstand extreme weather events, such as storms and floods, ensuring that operations remain uninterrupted in the face of climate adversities.
Through these climate-resilient strategies, hatcheries are not only protecting their investments but also contributing to the larger goal of sustainable aquaculture. By anticipating and adapting to climate challenges, we can continue to provide reliable, high-quality fish products to meet the needs of a growing global population.
As we’ve explored, the journey towards sustainable hatcheries is marked by innovation, adaptation, and a commitment to environmental stewardship. By integrating renewable energy sources, adopting advanced management technologies, and enhancing climate resilience, hatcheries are paving the way for a more sustainable future in aquaculture.
It’s a path that requires ongoing collaboration, research, and a willingness to embrace change. As we move forward, we must continue to challenge traditional practices and explore new avenues for sustainable development. By doing so, we not only ensure the viability of hatcheries but also contribute to the global effort to create a more balanced and harmonious relationship with our planet.
Let us, therefore, embrace the challenge with vigor and determination, recognizing that the innovations we implement today will shape the landscape of aquaculture for generations to come. Together, we can build a future where sustainability and production coexist in harmony, ensuring that hatcheries remain a vital part of our world’s food system.
FAQ
What are some energy-efficient practices that hatcheries can implement?
Hatcheries can adopt energy-efficient practices such as using LED lighting, optimizing HVAC systems, implementing automated environmental controls, and utilizing renewable energy sources like solar panels to reduce energy consumption.
How can hatcheries benefit from incorporating renewable energy sources?
Incorporating renewable energy sources like solar or wind power can significantly lower operational costs and reduce the carbon footprint of hatcheries, contributing to a more sustainable operation.
What role do automated systems play in enhancing sustainability in hatcheries?
Automated systems help optimize resource use by precisely controlling temperature, humidity, and ventilation, leading to reduced energy consumption and improved efficiency in hatcheries.
How can water management strategies contribute to sustainability in hatcheries?
Implementing water recycling systems, rainwater harvesting, and efficient filtration processes can minimize water usage and waste, supporting sustainability goals in hatcheries.
What innovations are emerging in hatchery design to promote sustainability?
Innovations such as green building materials, energy-efficient equipment, and integrated systems for waste management are emerging to ensure hatcheries are built with sustainability in mind, reducing their ecological footprint.