
In the evolving world of aquaculture and poultry production, staying ahead of potential issues is not just beneficial—it’s essential. With the adoption of advanced technology, we can monitor and manage our hatcheries more effectively than ever before. By integrating data systems and sensors, we’re not only ensuring the quality of our fish and egg products but also promoting sustainable practices that benefit both the industry and the environment. Let’s journey through how these innovations are reshaping our approach to early problem detection in hatcheries.
Harnessing Sensors for Optimal Hatchery Monitoring
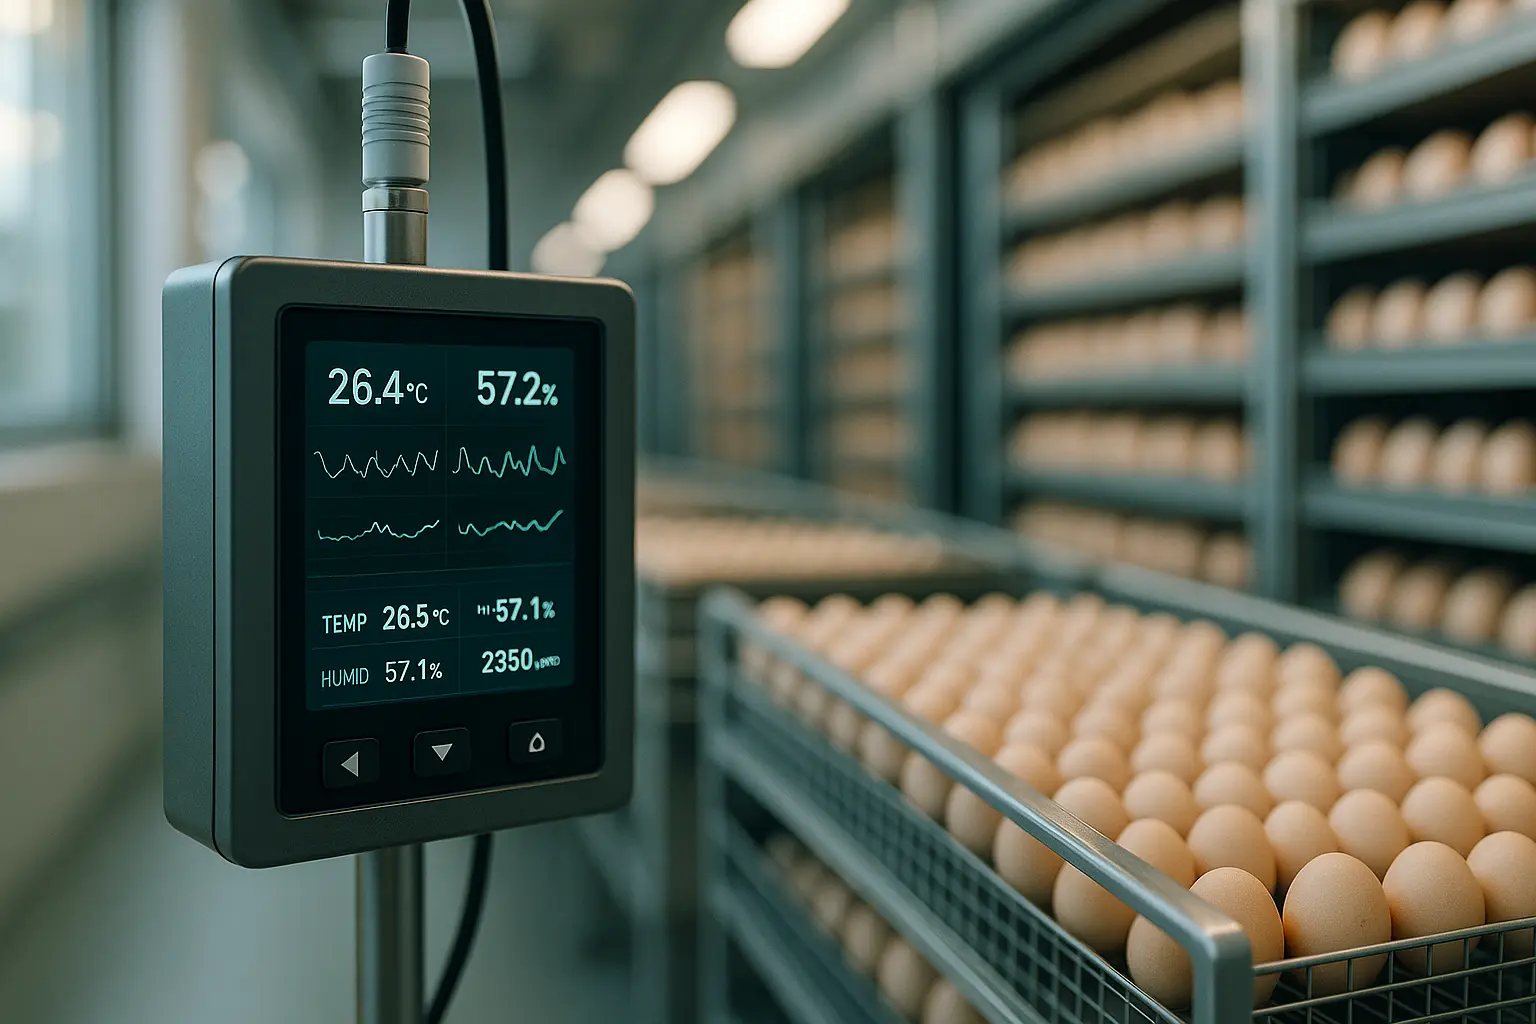
Our industry has seen a remarkable transformation with the introduction of sensors in hatcheries. These tiny yet powerful devices play a significant role in maintaining the health and growth of aquaculture and poultry species. By providing real-time data, sensors help us monitor everything from temperature to humidity levels, ensuring the ideal conditions for both eggs and young fish.
In practice, sensors are strategically placed throughout the hatchery, providing a constant stream of data. This allows us to detect any anomalies swiftly, enabling timely intervention. For instance, a sudden drop in temperature can be immediately addressed, preventing potential growth disruptions or health issues in the hatchery occupants. Similarly, sensors detect changes in air quality, helping us maintain a safe and healthy environment.
What makes these sensors indispensable is their accuracy and efficiency. They empower us to make informed decisions, significantly reducing operational risks and ensuring product quality. When it comes to monitoring hatcheries, prevention is always better than cure—and sensors are our first line of defense.
Data Analysis: A Game-Changer in Hatchery Management
In today’s digital age, the power of data cannot be underestimated. With vast amounts of information at our disposal, the challenge lies not in collection but in analysis. By leveraging sophisticated data systems, we can gain insights that were previously unimaginable.
Hatchery management is no exception. Through detailed analysis, we can identify trends and patterns that help shape our operational strategies. For instance, by analyzing temperature fluctuations and their impact on egg development, we can optimize conditions to enhance growth and product quality.
Moreover, data analysis allows us to spot potential issues before they become critical. With predictive algorithms, we can forecast problems and implement preventive measures. This proactive approach not only improves efficiency but also reduces costs associated with health interventions and quality control.
By focusing on data analysis, we embrace a future where decision-making is backed by empirical evidence, ensuring our market remains competitive and robust.
Market Trends in Aquaculture and Poultry: Embracing Technology
As global demand for aquaculture and poultry products rises, staying competitive requires us to embrace technological advancements. The market is witnessing a shift towards innovative practices that not only improve product quality but also enhance sustainability.
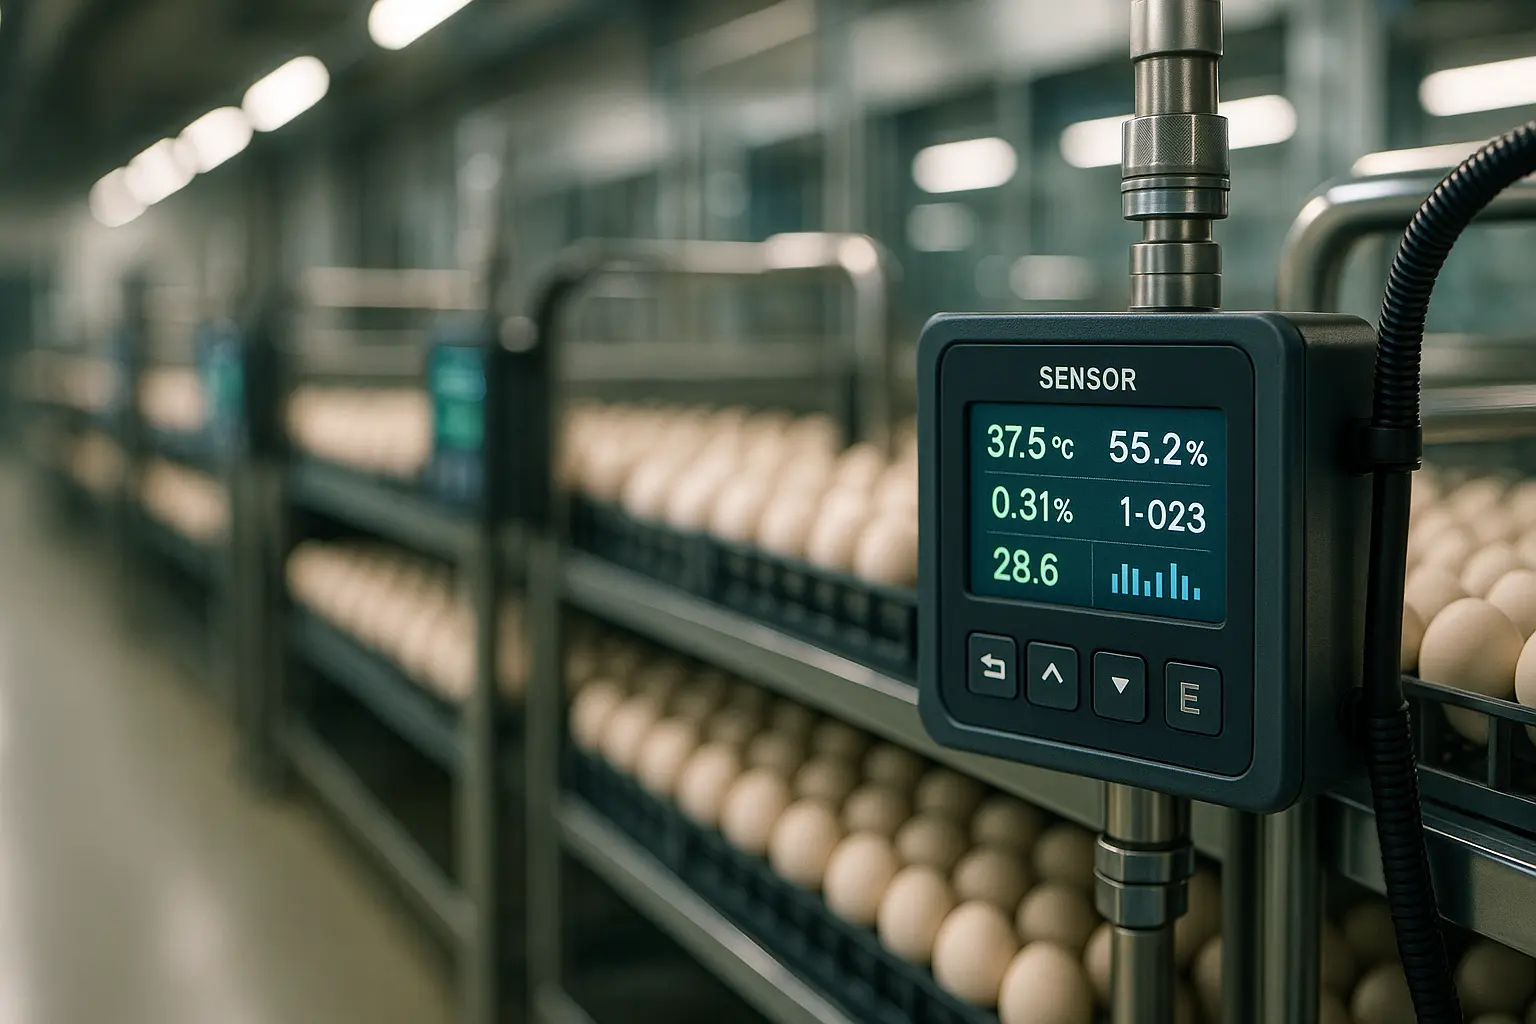
One of the most significant trends is the integration of sensors and data systems. These technologies enable producers to optimize management practices, ensuring consistent product quality and reducing waste. By embracing these innovations, we can meet consumer expectations for transparency and sustainability while maximizing efficiency.
The adoption of technology also opens new market opportunities. With a focus on health and growth, we’re seeing an increase in consumer preference for products that are traceable and responsibly sourced. By leveraging data-driven strategies, we can deliver on these expectations, ensuring our products remain top of mind for conscious consumers.
In conclusion, the market is evolving, and as leaders in the industry, we must adapt and innovate to stay ahead.
Concluding Thoughts: Towards a Sustainable Future in Hatchery Management
Our journey through the role of sensors and data analysis in hatcheries has highlighted the transformative impact of technology on our industry. As custodians of animal welfare and product quality, it’s our responsibility to ensure sustainable practices that safeguard our future.
By harnessing the power of sensors and data, we can reshape our approach to hatchery management, turning challenges into opportunities for growth and innovation. This proactive mindset not only enhances quality and efficiency but also aligns with global sustainability goals.
As we move forward, it’s essential to continue exploring and investing in cutting-edge solutions. By doing so, we set a precedent for excellence, ensuring our market thrives in an increasingly competitive landscape. Together, let’s build a future where early problem detection in hatcheries is not just a possibility but a reality.
FAQ
What are the key benefits of using sensors in hatcheries for early problem detection?
Sensors provide real-time monitoring of environmental conditions, such as temperature, humidity, and light levels, ensuring optimal conditions for egg incubation and early detection of any deviations that could affect hatchling health.
How does data analysis enhance the efficiency of hatcheries?
Data analysis allows hatchery managers to identify patterns and trends that may indicate potential issues. By analyzing historical data, managers can make data-driven decisions to optimize conditions and improve overall hatchery efficiency.
Which types of sensors are commonly used in hatcheries to monitor environmental conditions?
Common sensors include temperature sensors, humidity sensors, carbon dioxide monitors, and light sensors. These devices collectively ensure that the hatchery environment remains within optimal ranges for egg incubation and chick growth.
How can predictive analytics be applied in hatcheries to prevent potential problems?
Predictive analytics can forecast potential issues by analyzing trends and patterns in sensor data. By predicting these problems, hatchery managers can take proactive measures to rectify conditions before they impact hatchling survival and development.
What challenges might hatcheries face when implementing sensor technology for problem detection?
Challenges include the initial cost of sensor installation, the need for ongoing maintenance, and ensuring that staff are trained to interpret sensor data effectively. Additionally, integrating sensor data with existing systems can be complex and may require technical expertise.